Introduction
There are a number of geophysical techniques available for archaeological prospection. Magnetometry was chosen to cover this area after consideration of the geology and the potential nature of the known archaeological remains. It is a swift and efficient technique which works by measuring minor changes in the earth’s magnetic field, leading to the detection of many different types of features including kilns, hearths, ovens, ditches and walls, especially where ceramic material or tufa have been used in construction. However, the results of a magnetometer survey can be severely affected by areas of modern disturbance and in the presence of ferrous material where dipolar readings will be evident.
Targeted ground-penetrating radar survey was also used this season to test the methods capability and potential on the site. As a complementary geophysics method to magnetometry, it serves to enable us to understand the nature of the buried remains in more detail but can also provide deeper penetration into the subsoil producing 3-dimensional results. GPR methods measure the time (calibrated in nanoseconds (ns)) elapsed between the transmission and reception of high frequency electromagnetic radio (or radar) waves that are sent into the ground. The electromagnetic waves propagate through the ground and either: reflect off of buried discontinuities; or continue deeper until the energy finally dissipates. Attenuation of the radar waves can occur, where the energy is absorbed or conducted within the subsurface. Reflections or hyperbole, denote buried features or subsurface within data sets that have contrasting electrical and magnetic properties. Through velocity analysis techniques, the time taken for reflected waves to return to the receiver is converted into depth measurements, allowing for depth estimations of identified features. Data sets acquired using GPR techniques can be effectively visualised either as radargrams or time slices. Radargrams display vertical sections through the soil, whereas time slices are used to display a series of horizontal subsurface plans at increasing depths. Both methods of displaying the data are useful for examining data sets. Time slices, in particular, provide a mechanism for analysing reflections at different depths within a horizontal plan, often making the different stratigraphic levels of features easier to identify.
For the geophysical survey, grids of 30 x 30 m were set out using a Leica TC 805 Total Station. The grid was established to ensure the survey traverses crossed the alignment of the archaeology at 30º. A topographic survey was carried out to record both the nature and form of the land as well as features within the landscape such as buildings and roads enabling the survey to be accurately geo-referenced. The magnetometer survey was undertaken using the Bartington Grad601-2 Dual Array Twin Fluxgate Gradiometer. Readings were taken at 0.25 m intervals along traverses every 0.5 m within 30 x 30 m grids. The readings were recorded by the on-board Grad-01Data Logger. The Bartington Grad601-2 in some circumstances is able to detect buried features up to a depth of 3 m, although excessive modern debris and disturbance on or near the ground surface can affect the results, and make it impossible to survey certain areas. Using the same grid orientation as for the magnetometer survey, a GSSI SIR-3000 was used for the GPR survey, using a 400 MHz antenna mounted on a cart system with an odometer. Traverses were collected using a zig-zag formation, with a traverse separation of 0.25m.
The topographic survey in 2012 was conducted using a Leica GPS 500 System. This system allowed for the fast collection of data and the ability to georeference the survey in the World Geodetic System (WGS) commonly referred to as “real world coordinates”. The benefits of both these factors are obvious. It should be noted that the data collection was limited to accessible parts of the site and that the steep drop along the southern edge of the ridge is inaccessible and under a tree canopy which affects the GPS signal.
Results
Topographic survey
The topographic results (Fig.1) quickly reveal the relative flatness of the overall ridge with the edges dropping away comparatively steeply. The overall height difference between highest and lowest point is 16m (101m asl - 117m asl).
The most obvious feature is the long, tongue-shaped depression in the centre of the site (A) that exactly corresponds with the location of the forum. This had been noted in a previous season of work but with the complete topographic survey in place this depression is all the more evident. It should be also noted that the location of the theatre (B) lies within a shallow depression that gently mimics the curvature of the theatre. The modern central road (C) which follows the ancient course of the via Latina is visible as a raised spine along the crest of the ridge. It is interesting to note that the main concentration of the settlement is limited to the central and flattest part of the ridge and that, particularly in the south eastern extreme of the site there is no evidence for roads just at the point where the ground falls away (D), albeit gently. In the north the key point of interest is that the inhabited part of the town appears to be confined to the flatter area (E) and as the land slopes away to the north and south, the evidence for structures appears to decline (F) and (G). The natural physical limits of the ridge are best exemplified by (H) where the land steeply drops away. Only in one of these areas (H1) is there any evidence of occupation.
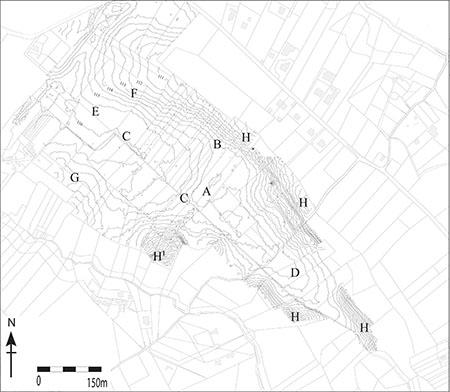
Figure 1: Topographic survey of the geophysical prospection area (2010-12).
Magnetometer survey
The magnetometer survey from all three seasons (Fig. 2-3) which covers the entire area of accessible land within the presumed city limits, is about 28 ha. The overall results are exceptionally clear and in general, the site has the benefit of not having been disturbed by modern ferrous material that causes disturbances in the results.
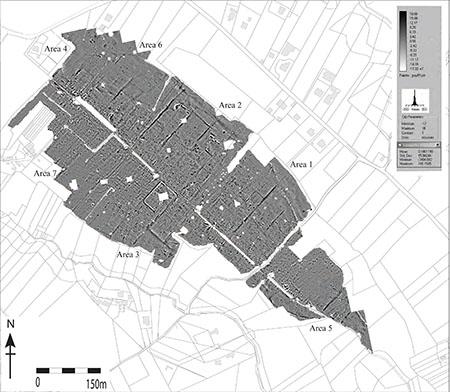
Figure 2: Results from magnetometry (2010-12).
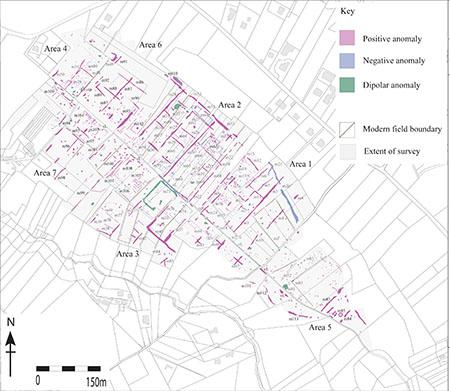
Figure 3: Interpretation of results from magnetometry (2010-12).
Anomalies [m1] to [m21] in Area 1 are discussed in the geophysical survey report of 2010. Anomalies [m22] to [m82] in Areas 2, 3, 4 and 5 are discussed in the survey report of 2011 all except [m67] in Area 2, which will be re-examined in this report. The 2012 season extended Areas 4 and 5 and covered new territory: Areas 6 and 7.
There are numerous linear positive anomalies aligned NNW-SSE and WSW-ENE, across the survey area, north and south of the via Latina and these represent the traces of modern field boundaries. Along many of the edges of these boundaries, and visible on the surface, are stone cairns built up of large limestone paving slabs from the ancient roads as a result of field clearance after ploughing. Traces of the plough marks can also be seen as very faint dark parallel bands across the entire survey area. Unfortunately, in the area to the south of the via Latina the modern field boundaries shift orientation slightly to match exactly that of the archaeology. In some cases this makes distinguishing between the two very difficult as ancient Roman roads and modern field boundaries are likely to coincide. In this southern area the plough lines are also aligned with the archaeology so again differentiating between agricultural traces and archaeological remains cannot always be done with certainty.
The most striking feature that dominates the results is a complex orthogonal network of linear positive anomalies [m83] to [m101] oriented northeast-southwest with a corresponding perpendicular alignment. These anomalies, unmistakably, represent the grid pattern of the ancient road system interlacing across the landscape and oriented on the via Latina [vL] that bisects the entire site. A narrow negative anomaly appears to trace much of the course of the via Latina and this is most likely a water conduit. The positive signal detected for the roads suggests that the large limestone paving slabs that make up these roads are more magnetic than the soil around them. The traces of the roads in the results are of varying lengths due to the preservation of the sub-surface features and the field clearance described above has had obvious effects. This orthogonal system, identified in the previous seasons of work, is now fully described in the results with some interesting observations that will be outlined below.
In 2011, Area 2 was defined by the clarity of the insulae blocks created by the orthogonal road layout. The reverse was true of the 2012 survey. The areas to the south, north and west and, Areas 5, 6 and 7, respectively, indicate a paucity of anomalies pertaining to the road system and divisions of insula blocks between them.
The extension of the survey Area 5 is characterised by a marked absence of the continuation of the road network and any sign of built up insulae blocks. Reminiscent of the southern part of Area 1, the lack of evidence is intriguing. It would appear that the inhabited part of the town does not extend this far south and that the general open area could suggest a land use for pastoral or agricultural activities. In marked contrast, Area 6 displays distinct anomalies forming a continuation of the orthogonal road system, albeit a lot less dense than in Area 2. Some insula blocks are apparent in this area, namely [m102]. Although the precise definition is not clear, there is a series of perpendicular positive linear features that suggest the presence of a group of buildings, rather than small individual habitations given the strength and scale of the anomalies. Within this structure there is a large square, positive anomaly which, given the seemingly monumental scale of this building could be significant. To the north of this insula there are faint rectilinear positive anomalies that are suggestive of occupation and further buildings and essentially these lie very close to the via Latina and may represent the remains of buildings flanking the main road. It is very peculiar that the rest of Area 6 is quite so devoid of anomalies apart from evidence of the road system [m86] to [m93]. This dearth of structural remains may of course be a consequence of the destructive force of deep ploughing but the fact that the road system is evident, even sparingly, suggests a level of conservation. Again, the idea that within the city walls areas were left open for pastoral activity should not be overlooked.
Area 7 occupies the area on the southern side of the via Latina. The results from this area mirror those of Area 6 and highlight the fact that the built up area hugs the edge of the via Latina and does not extend to the edge of the territory. This strongly suggests that the notion that ploughing may have destroyed parts of the town is wrong, and that the settled part of the town was limited to within the reaches of the main road and concentrated in the centre of the plateau. There is some evidence for the orthogonal layout of the road system [m94] to [m101] in this area that perfectly and neatly coincides with the roads visible in Area 6. It is interesting to note that in both Areas 6 and 7 the road system continues to the edges of the settlement even if the occupied territory does not. Flanking the southern edge of the via Latina is a series of positive linear features [m103] and [m104]. Their clear alignment with the main road suggests structures opening onto the street and there may be evidence of floor surfaces present. The density of anomalies in this area, immediately adjacent to the road, is striking in comparison to the area directly to the south-west. The nature of the anomalies suggests small structures, possibly shops.
This is in sharp contrast to the larger, more evident, anomalies present to the south in the insula block [m105]. Reminiscent of the type of anomalies seen in [m102] that indicate the presence of a more substantial structure, the linear positive anomalies of [m105] appear to define a large rectangular structure. Measuring about 25m x 10m it looks contain possible flooring or piers as there are regular appositive anomalies within it arranged along a central axis. Immediately to the south there are clusters of negative linear anomalies [m106] indicating that the building material differs from construction material of the structures associated with [m105]. The other obvious difference is the scale of the responses suggesting that the buildings are less monumental. This phenomenon is seen immediately to the north with [m107]. To the north of this there is a seemingly open area with no clear internal divisions but there is potential evidence for a large enclosure [m108]. Since there is no real clear evidence for a dividing road through the middle of this area, despite there being clear evidence of a road on the north side of the via Latina [m27] it is possible that the large structure and enclosure are linked.
The only other distinctive linear anomalies are [m109] at the very north-western extremity of the site. These linear features represent the last visible trace of the ‘occupied’ settlement but there is no clear indication as to what they represent. The important point to note here is that the main settled town ends abruptly here both north and south of the via Latina and only a few anomalies are present against the edges of the main road beyond this point. Presumably the edge of the town coincides with the steep drop at the edge of the north-western extent of the survey.
The perimeter and demarcation of the edge of the town is an interesting point of discussion. There is no obvious evidence for a perimeter wall and it may be that the natural topography acted as a physical limit of the edge the settlement. On the northern length of the site there is positive anomaly that was detected in the 2011 season [m53] which could represent the limit of the town as the roads do not appear to cross this boundary. This anomaly coincides with a sharp break in slope in the topography however and could simply indicate a banding in the geology. [m110] denotes two very strong positive linear features with a negative band between them. It is unclear what this feature is as it lies so close to the field boundary. However, it is conceivable that it relates to [m53].
There is no clear evidence of a boundary to the town in the extreme southwest of the site in Area 5 either. A series of curvilinear positive anomalies [m111] to [m113] hug the steep contours of the area and probably denote the presence of a sharp change in the geology similar to that of [m20]. Immediately to the north of these anomalies and to the north of the via Latina there is evidence of positive anomalies. [m83] and [m84] share an alignment with the roads seen across the site and could represent two more roads in this area. A cluster of positive anomalies [m85] lying between the roads appear to represent the structural forms of a rectangle and circle but their interpretation remains unclear.
Overall, this season of survey has revealed more about the extent and density of the actual occupied territory versus that of open, possible pastoral land within the limits of the plateau. What is striking is the dense occupation in the central section with a dramatic drop-off towards the north and south extremities. The key point of interest is the fact that the main occupation is confined to the central section of the site and the peripheries remain seemingly open perhaps for pastoral or agricultural use. The “ribbon” development at the extremities of Interamna Lirenas is a surprising discovery but no less interesting for that very fact. The detail of function associated with the built up area can only be gauged by the apparent size of the construction – larger more dominant anomalies may represent monumental or civic buildings with the smaller anomalies suggesting more minor structures.
Ground-penetrating radar survey
Three areas were chosen for targeted GPR survey (Fig. 4) in order to test the capability of this technique on this site and act as comparative data to the magnetometer survey. Any depth measurements discussed here are estimates and are used as a guide only. Without the direct comparison and application of known depths of features it is impossible to give accurate depth measurements.
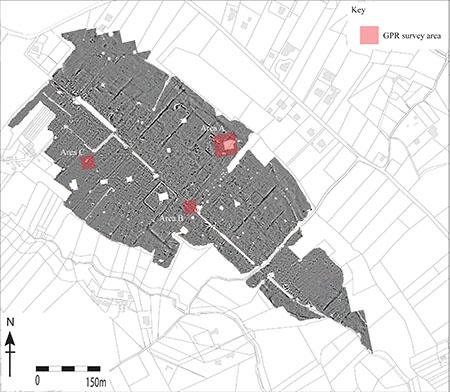
Figure 4: GPR survey areas
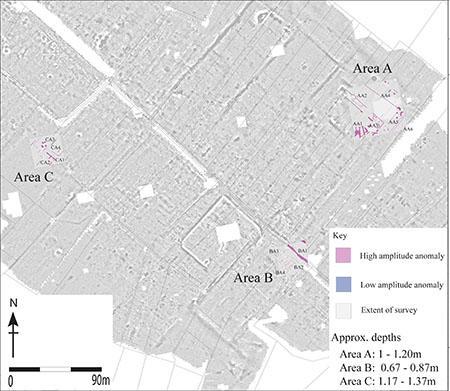
Figure 5: Interpretation of the results from the GPR survey (timeslice A)
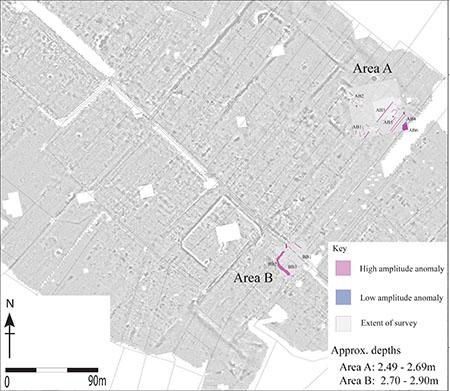
Figure 6: Interpretation of the results from the GPR survey (timeslice B)
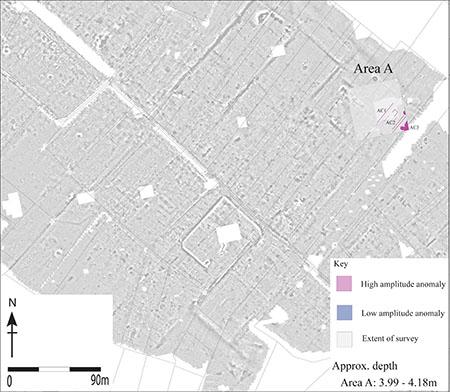
Figure 7: Interpretation of the results from the GPR survey (timeslice C)
Area A
This area (50m x 50m) was chosen for two strategic reasons. Firstly, it covered an area over a major building complex adjacent to the forum visible in the magnetometer survey results. Secondly, the area had been heavily disturbed by the presence of something highly ferrous and had obscured the gradiometer results as well as causing concern that the buried object could be related to World War Two ordnance. First, and foremost, it should be emphasised that no World War 2 ordnance was identified in the GPR survey of this area. The GPR survey of this area, once overlaid on the magnetometer survey results, clearly demonstrated that the initial interpretation of this area had been misguided by the seemingly rectilinear nature of the features. Instead, the results strongly suggest the presence of a theatre structure. The form of the structure appears to be enclosed within an insula shape. Three timeslices, at varying depths in Area A, will be discussed:
- Timeslice A: 1 - 1.20m (Fig. 5). The most prominent cluster of anomalies is a set of high amplitude linear features [AA1]. This series of radiating lines start appearing at a depth of about 33-53cm below the surface. At this depth they are very prominent and are indicative of the radial supports for the outermost tier of seating. The inner tier of the cavea, that by virtue of the proportions of the theatre must have existed around the orchestra, does not appear in any of the timeslices. There are two parallel high amplitude anomalies signifying the presence of a substantial structure [AA2] that run northwest-southeast across the survey area. It is clear that these anomalies represent the stage/scene area of the theatre. In the south-eastern extreme [AA3] denotes a clear rectilinear subdivisions of this area and could represent the corner turret at the end of the stage area. Beyond the theatre to its north is a high amplitude linear anomaly [AA4] which appears on a slightly different orientation. When seen in context with the magnetometer results is it most probable that this represents the course of a road or at least something such as a drain that runs along the orientation of the road. There are two parallel lines [AA5] that seem to represent the traces of potential walls. Their form is not clear but the deeper slices add some clarity. A very faint series of high amplitude anomalies are seen in the extreme south east corner of the survey area [AA6] and it is most likely that this represent part of a field boundary.
- Timeslice B: 2.49 - 2.69m (Fig. 6). In this deeper slice, it is evident that the supports for the tiered seating are still visible [AB1]. However, much of the stage area has disappeared and only fragments are visible [AB2]. The last slice with clear evidence of this area of the theatre is the slice taken at 1.99-2.19m. The high amplitude linear feature [AB3] and the low amplitude linear feature [AB4] both correspond with field boundaries and are probably not related to the archaeological remains. However, between these two anomalies lies a series of high amplitude features [AB5]. Although they lie very much in line with agricultural traces their intensity is worthy of note. They could represent walls and there is a rectilinear feature which could be a smaller structure contained within a large complex. The magnetometer results yielded little evidence in this area and were heavily disturbed by the ferrous object. Thus it was always unclear where the forum may have ended but if this a structure it would be directly associated with the forum. It may be far-fetched but given its position it could represent a temple. It is unclear what the amorphous high amplitude anomaly [AB6] indicates but it is most likely an accumulation of material along a field boundary.
- Timeslice C: 3.99 - 4.18m (Fig. 7). This is the first time slice that indicates that most clear traces of substantial archaeological remains have disappeared, principally the theatre complex. Persistent, however is the field boundary [AC1] which clearly continues. Also present are the parallel lines [AC2] that may represent structures of a building associated with the forum. If these are indeed representative of structures then their presence in this slice suggests a deep stratigraphy of deposits. Throughout all the intervening slices there is a consistent high amplitude anomaly [AC3] which is analogous to an accumulation rather than denoting a discreet structure.
Area B
This area (30m x 30m) was chosen as it lies at the southern end of the forum and incorporated part of the via Latina. The magnetometer results had not yielded much in this area and given its location it was hoped that the GPR results could clarify what archaeological remains existed. Two timeslices, at varying depths in Area B, will be discussed:
- Timeslice A: 0.67 - 0.87m (Fig. 5). This is a fairly shallow timeslice but roughly corresponds with the first timeslice in Area A. Most evident is the high amplitude anomaly running northwest-southeast across the survey area [BA1] which corresponds with the course of the via Latina. The signal is very strong suggesting that there are still paving stones in situ. To the south of the road there are clear indications of structures denoted by a series of rectilinear high amplitude anomalies. Of particular note is [BA2] which represents a series of cells aligned with the main road. A close study of the magnetometer results reveals there are some similarities but no strong evidence based on those results alone. The structure complex measures about 25m by 25m and is defined by 4 adjacent spaces. Although attributing a function is not possible their location adjacent to the forum strongly suggests a civic function. Other high amplitude anomalies denote other structures [BA3] and [BA4]. What this timeslice demonstrates is that the territory is more fully occupied than is immediately evident in the magnetometer results and that this integration of techniques is fundamental to understanding the town and its layout.
- Timeslice B: 2.70 – 2.90m (Fig. 6). This is a deeper timeslice and is nearly equivalent to timeslice B in Area A. The via Latina is no longer evident but there is a discreet linear high amplitude anomaly [BB1] that runs along the same alignment and may be evidence of a drain under the road. There is a large mid amplitude anomaly [BB2] that could represent the outline of a substantial structure but its width (~5m) could also suggest the presence of a road or track way as the anomaly shares many properties with that of the main road, the via Latina. At this depth internal division of an insular can be seen [BB3] that correspond to the previous timeslice.
Area C
This area (30m x 30m) was chosen as it lay in an area beyond the occupied territory as defined by the magnetometer survey and in an area where the deposits could be more deeply buried. The results from this area provided very ephemeral anomalies that could pertain to archaeological remains. The main issue here is that the archaeology and modern agricultural activity share the same alignment and so distinguishing between the two is made difficult and should be taken into consideration. One timeslice in Area C, will be discussed:
- Timeslice A: 1.17 – 1.37m (Fig. 5). This timeslice is comparable with the previous two areas’ uppermost timeslices. Overall, a faint orthogonal patterning can be seen across the area. Dominating the results is a linear high amplitude feature [CA1] that nearly corresponds with a field boundary. However, there are many perpendicular high amplitude anomalies that appear to relate to it [CA2] so supporting the notion that it could represent an archaeological structure. In the timeslices immediately preceding this slice these and other similar anomalies are readily visible so adding support that they represent archaeological remains. There is a very ephemeral trace of a high amplitude anomaly [CA3] which appears in this slice and many successive ones. Given its orientation and alignment with other anomalies in the magnetometer data it could be suggested that this is a road. However, this is more based on its position than its signature. Adjacent to this anomaly is a roughly rectilinear mid amplitude feature [CA4]. It appears, in part, at depths of between 0.67m and 1.53m so seems more substantial than simple agricultural activity and if it is a structure, no detail can be ascertained. The rest of the timeslices for this area yield very little and the archaeological remains are very close to the surface.
Conclusions
Overall, this season of survey has revealed more about the extent and density of the actual occupied territory versus that of open, possible pastoral land within the limits of the plateau. The detail of function associated with the built up area can only be gauged by the apparent size of the construction – larger more dominant anomalies may represent monumental or civic buildings with the smaller anomalies suggesting more minor structures. The key point of interest is the fact that the main occupation is confined to the central section of the site and the peripheries remain seemingly open territory strongly suggesting the main core of the settlement lies in the centre. The “ribbon” development of Interamna Lirenas is a surprising discovery but no less interesting for that very fact. It does appear that to the north of the main central occupied zone the road system continues but the evidence for structures really only exists along the main roadside. The results of the surface collection will no doubt aid in the chronological span of the development of the town. The GPR results in Area C may confirm that the area is more densely occupied in areas further from the roadside than previously thought but the GPR survey would have to be extended in this area to gauge this with any certainty.
Perhaps the most beneficial aspect of having implemented an integrated geophysical survey was the interpretation of Area A GPR results in combination with those of the magnetometer data. The revelation that there was a theatre adjacent to the forum has proved invaluable. The topographic survey also reveals that the location of the theatre was chosen as there is a natural depression which was no doubt more acute in antiquity.
Overall, there is no doubt that the understanding of a townscape such as Interamna Lirenas can really only be sought by integration of survey methods including geophysics, topography and surface collection.
